Question 1:
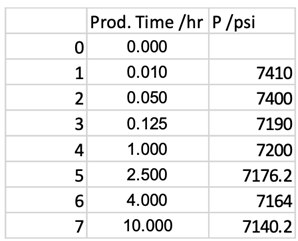
The data given in the table below refers to a constant rate drawdown test performed on an oil well with a circular drainage area.
1. Prepare the semi-log plot for this test.
- Identify any type of observed deviations from the semi-log plot and discuss the reasons for each.
- Use any two points in the MTR region to estimate permeability and skin.
A buildup test was performed after 200 hrs of production; please note that semi- steady-state was experienced after 100 hrs. Analysis of this buildup using the modified Horner plot has given P*=7000 psi and the same skin and permeability that were obtained using DD analysis.
2. Calculate:
- Average reservoir pressure.
- Considering the same production time, calculate both the drawdown the radius of investigation and build up the depth of investigation if dpgr=0.5 psi and compare these two calculations in terms of the parameters used and the final value.
Prepare the plot in a (i) in Log base 10 (i.e. not natural log). Use the corresponding equations that are in the attached sheet and based on Log base 10.
Reservoir Data:

h = 231 ft,
CA = 31.62,
qs =2000 STB/D,
Bo = 1.2 RB/STB,
Pi=7580 psi
rw = 0.35 ft,
f = 0.24,
ct = 3.8*10-5 psi-1,
mo = 0.71 cp.
re=800 ft.
Question 2
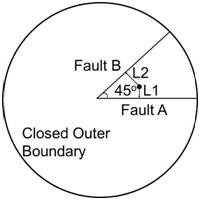
A well that fully penetrates the whole producing zone of a bounded homogenous reservoir is distinctly closer to a sealing fault A, which intersects another sealing fault B with a 45-degree intersection angle as shown in this Figure. The outer boundary encircling the good drainage area is much further away from the well. Assume the well is producing from a valve at the surface with a constant rate.

- Draw a schematic diagram of diagnostic log-log derivative signatures identifying the corresponding full signatures of the ETR, MTR and LTR flow regimes of a drawdown performed in this well with full boundary effects
- Identify the specialised plot for the flow regime capturing the effect of the closer fault and the information that can be obtained from this plot.
- On a different plot show ONLY the signature of the section related to the two faults if fault A was a leaky one with a moderate transmissibility ratio of a~1.0.
Question 3
A vertical well is perforated across the whole producing interval resulting in a positive skin of 2.5 compared to an open hole system. Later it was decided to fracture this well across the whole producing interval, which would give a negative skin of (-5) due to fracturing ONLY. Using the given reservoir data:
- Calculate the semi-steady-state productivity index, based on external pressure, (Jssse) for the open hole, perforated well and perforated-fractured well and compare these three values to highlight the impact of perforation and fracturing.
- Calculate Jssse for the perforated-fractured well which also suffers from a damaged skin of 1.5. Compare this value with the open hole value calculated in part (a) to highlight the impact of damage, as well as perforation and fracturing on the good performance.
kh = 20 mD,
Bo = 1.2 RB/STB,
h = 100 ft,
rw = 0.45 ft,
m = 0.6 cp,
re=1000 ft.
kv = kz = 0.2 mD.

