| ANL203: Business Analytics |
Identified Business Problem
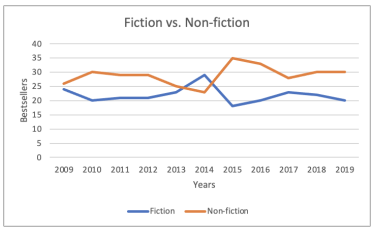
One business problem that can be addressed by analyzing the data is finding out which genre to increase the marketing budget or strategy for. As seen from the summary, there is a clear division of fiction and non-fiction bestsellers with non-fiction being predominantly more than fiction. By categorizing the data in years, we are able to notice a trend that there is a preference and demand for non-fiction books.
With the identification of the underperforming genre, the business can then rectify this problem by focusing on the marketing and sales campaigns for these genres. For example, Amazon can identify other popular contending bestsellers and place them on top and noticeable visual placements of the website to encourage purchases. Another way is to promote the entire genre, in general, is to encourage fiction readers to try out different books.
Graphical Charts

Using the summarised data in each year, we are able to create a line chart with trend lines graphical chart to view the trend of genres throughout 2009 to 2019. By using the years as the x-axis and the number of fiction and non-fiction bestsellers as the y-axis, we are able to generate a graph with the trend line.
This professional graphical chart is recommended as it visualizes the data in a time-series chart in chronological order, showing a visible and obvious trend of how there are more preferences for nonfiction books than fiction books over the years.
The post ANL203: Business Analytics Identified Business Problem One business problem that can be addressed by analyzing the data is finding out which genre to increase the marketing budget or strategy for. As seen from the summary, there is a clear division of fiction and non-fiction bestsellers with non-fiction being predominantly more than fiction. By catego appeared first on My Blog.

