Assessment Tasks:
Task 1
You are required to submit four (4) primary researched quantitative papers for this task. You are to review the selected papers by discussing aspects such as aim, methods, sampling, results, and findings of each paper. You need to ensure you critically discuss these aspects of each of the four selected papers. Use references to support your discussions. Be aware of being descriptive in your write up. You can resubmit already submitted papers from your first submission with better write up if the paper is a primary researched quantitative paper, please avoid review or systematic review paper (1000 words).
Task 2
In your first submission, you were required to explain four (4) key terms from the eight (8) terms given. For this resubmission, you will write on the four terms you did not select for submission i.e the alternative four 4 key terms left from the first submission (800 words).
- Confounding
- Confidence interval
- Case-control study
- Cohort study
- Hypothesis testing
- Reliability
- Confidence level
- Internal validity
The data presented below is one of the 4 tasks to be completed for the assessment for this module. This will focus on task 3 and 4 in your assessment guide.
Task 3 Data analysis
You have been asked to analyze the data presented, make clear justification for the statistical test, and summarise your analysis. Use the task guide provided for 3 on Moodle from the previous submission to answer this task (600 words).
Label this task as Task 3 in your assessment submission. All answers should be clearly labeled and show workings carried out as needed.
- A cruise ship from Singapore to the UK carrying 600 people was quarantined for possible infection with a deadly virus. All 600 people were tested for the virus, 150 of these people tested positive for the virus.
- Estimate the prevalence of the virus in the people on the cruise ship and provide a 95% confidence level for the estimate.
60% of the people on the cruise ship wore protective face masks throughout their time on the ship, 15% of these people tested positive to the virus.
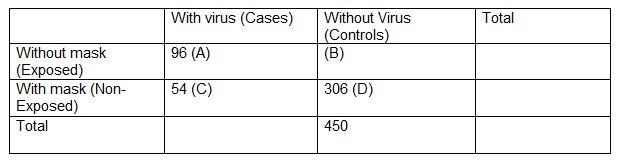
- Complete the given 2×2 table for the data derived from the 600 people on the cruise ship.
- Estimate the following from the table
Odds ratio
Risk (rate) ratio
Risk (rate) difference
for those who did not wear a face mask on the ship compared to those that wore the face mask.
- A statistician performed a Chi-square ( 2) test and obtained a p-value of 0.005 on those that wore and those that did not wear the face mask, what does this mean?
- The face mask is now a very scarce commodity in Singapore, it was suggested that families with higher socioeconomic status are more likely to have access to a face mask and are more likely to get immediate treatment. Families were grouped into three socio-economic categories.
- Which statistical technique can be used to examine the association between the use of face mask and the virus infection while taking the difference in socio-economic status into consideration?
- Adjusting for socioeconomic status among the people, will the adjusted estimate be closer to the null hypothesis or further from the null hypothesis than the unadjusted estimate from 2. (II)? Give an explanation for your answer.
Task 4 Data analysis
A statistician wants to perform research to investigate if there is a difference between male and female participants in a study using coffee. A researcher collected a sample of test scores from male and female university students. The research aimed to determine if there is a difference between male and female test scores. Feel free to support your submission with tables and graphs if available, also support with reference(600 words).
- What are the considerations required to choose an appropriate statistical test?
- What statistical test will you recommend for the researcher to determine differences between male and female test score
- State the Null and alternative hypothesis for the suggested test in 2.
- If the researcher performs the test in (2) and found a p-value of 0.03, what does this mean in regards to the hypothesis for the test (Explain in detail)?
- The researcher wrongly rejected the null hypothesis when the null hypothesis was true, what type of error has the researcher made. Explain your answer in detail.

