EBM3005 Energy Management and Audit Assignment: Energy Performance Evaluation of a Water-Cooled Central Chilled Water Plant and Air Distribution System Using Live Audit and BMS Data
Brief for Project (50%)
I. INTRODUCTION
The air-conditioning system uses the most energy in a typical air-conditioned building in Singapore and may account for as high 60% of the overall electricity consumption of a building. It is therefore imperative that in, evaluating energy performance of a building, there will be greater emphasis on the energy usage and performance of the building’s airconditioning system.
The project hence focuses on evaluating the energy performance of a water-cooled central chilled water plant (CCWP) and air distribution system (ADS) of a centralized airconditioning system. Two methodologies of data collection (audit) and evaluation have been applied.
II. COMPONENTS
Objective: Energy performance analysis of a water-cooled CCWP
| Deliverable | Task Description | Weightage | Submission Date |
|---|---|---|---|
| Report 1 | Live Energy Audit | 20% total (Individual: 16%, Group: 4%) | 9 June 2025 |
| Report 2 | Operating Data from BMS | 25% total (Individual: 16%, Group: 9%) | 18 August 2025 |
| Reflective Journal | Learning Process | 5% (Individual only) | 18 August 2025 |
III. SCOPE OF WORK: REFLECTIVE JOURNAL (5%) – Individual
Deliverables: 500-word Word document
| # | Items | Remarks | Marks (10) |
|---|---|---|---|
| 1 | Effectiveness of F2F lessons, tutorials, video recordings, SW26B chiller plant tour & IBEC airside systems’ (IAQ audit) practical sessions | Nil | 5 marks |
| 2 | Process of applying learning from Topic 1 and 2 to project scenario | Nil | 5 marks |
Hire a Professional Essay & Assignment Writer for completing your Academic Assessments
Native Singapore Writers Team
- 100% Plagiarism-Free Essay
- Highest Satisfaction Rate
- Free Revision
- On-Time Delivery
IV. SCOPE OF WORK: PART A (Report 1 – 20%)
- Objective: Energy performance analysis for a water-cooled CCWP
- Data collection: Live Energy Audit
| # | Items | Remarks | Marks |
|---|---|---|---|
| 1 | Data collection – Table 1 to Table 10 including photo-evidence (if available) | Annex A: Live-audit data | 20 |
| 2 | Calculation of CHW & CW flowrates for CCWP and CHW flowrates for the AHUs | Annex B: Schedule of CCWP Equipment | 16 |
| 3 | Sketching of system curves on pump curves: CHW loop & CW loop: – Design flow vs. Design head → Design Point (DP) – Measured Flow vs. Measured Head → Operating Points (OP1: WPL formula, OP2: VFD formula, OP3: Flow-meter reading) | Annex C: Specifications for pumps & cooling towers | 8 |
| 4 | Analysis of plotted system curves – Design vs. Actual system curve | Based on Item 3, Table 2, Table 4 & Table 10 data | 3 |
| 5 | Evaluation of space conditions (Table 7) with SS 554:2016 for non-compliance | TP Library link to SS554:2016 | 3 |
| 6 | Calculate various performance parameters of the water-cooled CCWP and ADS | Performance parameters under Individual Scope of Work & Annex D: Summary table with hints for calculation | 50 |
| 7 | Comparison and analysis of air-distribution system efficiency with Green Mark ENRB 2017 criteria | Annex E: Hints for comparison Annex F: Schematic of BMS for AHUs in IBEC | 25 |
| 8 | Assessment of chiller efficiency under actual operating conditions vs rating conditions | Refer to screenshot below table for PL data of the ETI-50 chiller |
Discussion Questions
4. For the CHW circuit, please refer to the following:
a. The actual system curves which you have sketched in item 3 above.
b. The evaporator (chilled) water flowrates summarized in Table 10 of the
template.
Based on these sources of information, discuss possible reasons why the actual system curves lie above or below the design system curve.
[Please DO NOT treat (a) and (b) as separate questions to be answered!]
5. Evaluate whether the measured space conditions in Table 7 comply with requirements of SS 554: 2016. (Note: for the IBEC renovation works, design & construction started in late 2019 and were completed by late 2020 / early 2021).
Buy Custom Answer of This Assessment & Raise Your Grades
6. Calculation of performance parameters of the water-cooled CCWP and ADS:
a. Power factor of the chiller compressor
b. Motor Input Power (kW) of the CHWP
c. Motor Input Power (kW) of the CWP
d. Motor Input Power (kW) of the CT
e. Total Input Power (kW) of the CCWP
f. Actual Cooling Capacity (RT) of the Chiller
g. Part load (%) of the Chiller
h. Efficiency (kW/RT) of the Chiller
i. Efficiency (kW/RT) of the CHWP
j. Efficiency (kW/RT) of the CWP
k. Efficiency (kW/RT) of the CT
l. System Heat Balance (%), of the CCWP (based on Primary & Secondary Loop)
m. Operating System Efficiency, OSE (kW/RT), of the CCWP
n. Cooling capacity (RT) of AHU 1-1 and AHU 1-2
o. Motor Input Power (kW) of AHU 1-1 and AHU 1-2
p. Efficiency (kW/RT) of AHU 1-1 and AHU 1-2
q. Room Sensible Heat Gain (RSHG) of the spaces served by AHU 1-1 & AHU 1-2
7. In the Green Mark (GM) for Existing Non-Residential Buildings (ENRB) 2017 criteria, air distribution systems need to achieve 0.28 kW/RT efficiency or better. With reference to the efficiency of both AHUs (calculated based on CHW flowrate from USFM and electrical data from DPM), analyze the possible reason(s) for the difference between the actual efficiencies as compared to the baseline value above prescribed in GM ENRB 2017.
[Hint: Refer to the AHU data from the BMS (viz. Table 6), and consider also the
factors listed in (a) thru’ (e) below, in your answer]:
a) Chilled water cooling coils’ control valve positions
b) Cooling coils’ actual CHW flowrate and design CHW flowrate
c) Actual SA temperature, actual RA temperature and set-point RA temperature
d) Relationship between RSHG, SA flowrate, SA temperature and RA temperature
Vsa(m3/s) = RSHG (kW)/1.206 × (TDB1 – TDB4)°C
e) SA fan speed and its relationship to SA flowrate and fan motor input power
You will also need to refer to Annex E for other relevant material.
8. Complete the table below:
| Parameter | Based on Rating Conditions (corresponding to actual operating PL) | Based on Actual Operating Conditions (based on FM & DPM readings) |
|---|---|---|
| Entering Chilled Water Temperature (ECHWT) | ||
| Leaving Chilled Water Temperature (LCHWT) | ||
| Entering Condenser Water Temperature (ECWT) | ||
| Leaving Condenser Water Temperature (LCWT) | ||
| PL for Chiller (%) | ||
| EE for Chiller (kW/RT) | ||
| HB for Chiller (%) |
Stuck with a lot of homework assignments and feeling stressed ?
Take professional academic assistance & Get 100% Plagiarism free papers
Summary of Part Load (PL), Energy Efficiency (EE) & Heat Balance (HB) of Chiller
a. Based on your summary in the above table, assess the impact of the actual
operating conditions on the chiller’s energy efficiency (or Coefficient of
Performance, COP), relative to the rating conditions. (Hint: refer to what you
have learnt in ACMV Topic 3 – Chilled Water Systems and explain via a sketch
of the vapor compression refrigeration cycle).
b. Explain whether the computed energy efficiency of the chiller is within an
acceptable level of accuracy.
Deliverables:
- In the calculations for Part A (Report 1), screen-shots of the following shall be
submitted:
o Technical specification of cooling Coil for AHU 1-1 & AHU 1-2 – with the
design/rated CHW flowrates and corresponding water pressure losses
indicated
o CHWP and CWP system curves – with the Design Points and Operating
Points indicated - Each group shall submit one (1) consolidated softcopy of Report 1, in Word format.
- Each group leader needs to do the following:(a) Compile (in order of Member A, B, C & D) each student’s:i. Table 1 thru’ Table 10 in Word format and insert these immediately after the Project (Part A1) – Report 1 cover page for Individual Work as shown below (ie. a different cover page for each person):ii. Compile the completed work for items 2 thru’ 5 (all to be in Word
format) and insert these immediately after Table 10 above.b) Insert the cover page for Group Work (as shown below) immediately after
the last member’s completed individual work for items 2 thru’ 5:(c) Insert the group’s completed work for items 6 thru’ 8 immediately after
items (a)(i) and (a)(ii) above.The sequence will thus be as shown below:
Cover page for Individual Work
Table 1 thru’ Table 10 (Individual Work)
Completed Work for Item 2 thru’ Item 5 (Individual Work)
Cover page for Group Work
Completed Work for Items 6 (Individual Work) thru’ Item 8 (Group Work) - The structure of the report shall be based on the template provided.
- File naming convention: PEXX_Full Name_Report 1.
- The submission deadline is Mon, 9 Jun 2025, 1700 hrs.
Individual scope of work:
Each group to have a maximum of 4 students.
Hire a Professional Essay & Assignment Writer for completing your Academic Assessments
Native Singapore Writers Team
- 100% Plagiarism-Free Essay
- Highest Satisfaction Rate
- Free Revision
- On-Time Delivery
V. SCOPE OF WORK: PART B (Report 2 – 25%)
Objective: Energy performance analysis for a water-cooled CCWP
Data collection: Operating data from BMS (refer folder under project brief)
CCWP Schematic: Annex G
| # | Items | Remarks | Marks |
|---|---|---|---|
| INDIVIDUAL | |||
| 1 | Chart Plotting: System parameters | List of charts & calculations under Individual Scope of Work | 40 marks |
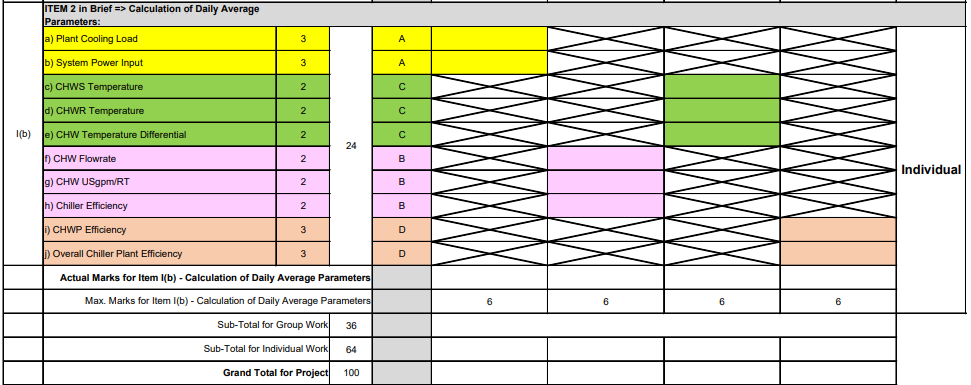
| 2 | Calculations: Daily average parameters | 24 marks | |
| GROUP | |||
| 3 | Summary tables and plant operation checklist (based on the charts) with calculations (Tables H1 – H3) | Annex H: Summary Tables | 14 marks |
| 4 | Comment on the following:
|
Refer to: – Table H1 & H2 with Chart 9 & 10 – Chart 1 – Topic 2, Sect 2-5, slide 18 (minimum OSE) |
7 marks |
| 5 | Select and EXPLAIN the minimum number of instruments/sensors to be installed in the chiller plant for determining OSE and HB of plant and individual chillers. | Annex G: Plant schematic | 5 marks |
| 6 | Select an alternative chiller to replace the existing 1200 RT constant speed centrifugal chiller operating on weekends.
Give reasons. Include a simple payback (SPB) analysis. |
Annex I: Assumptions for alternative chiller | 10 marks |
Discussion Questions
4. (a) Comment on the trend of Operating System Efficiency vs PL (Chart 9) and CHWP Efficiency vs PL (Chart 10).
(Hint #1: by means of a heavy broken red line, mark in the Daily Average overall
chiller plant efficiency (from Table H1) and the Time-Weighted Average chiller plant efficiency (from Table H2), onto Chart 9, to help clarify your explanation).
(Hint #2: in the same way as you calculated the TWA overall chiller plant efficiency – ie. OSE – using Excel, similarly compute the TWA efficiency of the CHWP).
(Hint #3: by means of a heavy broken red line, mark in the Daily Average CHWP
efficiency (from Table H1), and the Time-Weighted Average CHWP efficiency, onto Chart 10, to help clarify your explanation).
(b) Compare the Daily Average plant efficiency and TWA plant efficiency against the minimum OSE specified in the GM ENRB 2017 criteria, and hence explain which level of Green Mark award the building is most likely to qualify for.
(Hint #3: refer to your Chart 1 to determine the peak cooling load of the building and then to Topic 2 Sect 2-5 notes, slide 18 for the minimum OSE required).
Buy Custom Answer of This Assessment & Raise Your Grades
(c) With reference to Table H2:
i. Interpret the significance of the value for ‘% Heat Balance within ±5% error…’ in the last row of Table H2.
ii. Examine any three (3) possible reason(s) for the Heat Balance deviating from
the prescribed ±5% limits. (Hint: mark in a heavy broken red line on to the
plotted HB profile (Chart 11) to show the ±5% band, to help clarify your
answer).
5. Propose and explain the minimum number of each type of instrument/sensor to be installed in a chiller plant, for determining the OSE and system HB. Also, propose and explain the modifications required in terms of the required quantity of the relevant instruments/sensors if each chiller’s efficiency and Heat Balance is to be determined as well.
6. (a) From the raw data provided for Sunday, and using Excel:
i. Plot the Plant Cooling Load vs Time profile, using the same y-axis (RT) and xaxis (time) scale as for Chart 1. [Hint: scale the x-axis using 30-min intervals]. What do you observe about the general trend in the cooling load for Sunday as compared to that of weekday?
ii. With reference to the procedure outlined in Annex I, select a suitable,
alternative model of chiller to serve the existing cooling load profile, by referring to the table below:
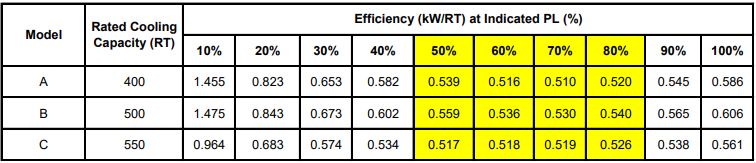
Part-Load Performance for Alternative Models
of Chiller To Meet Sunday’s Cooling Load
(b) The existing chiller serving the Sunday cooling load was originally a constant speed centrifugal chiller of 1200 RT rated capacity. Evaluate the cost-benefit of replacing this centrifugal chiller with the selected alternative model, by using the Simple Payback method. Refer to Annex I for the relevant assumptions.
Reflective Journal (Individual Work)
Each student is required to write a maximum 500-word Reflective Journal (Arial, 12-point font size), describing your learning experience while doing this Project. In particular:
i. Explain whether and how the F2F lessons, tutorials, video recordings, and the
IBEC CCWP & airside systems’ tour, have helped you in doing the Project.
ii. Highlight whether and how the topics you have learnt in EMAUDIT Topic (ACMV System Architecture) and Topic 2 (Measurement & Verification) may have helped you to better understand the application of the concepts covered in the Project.
Stuck with a lot of homework assignments and feeling stressed ?
Take professional academic assistance & Get 100% Plagiarism free papers
Report 1 – Item 6:
| Item | Description | Max. Mark | Member | Total Mark |
|---|---|---|---|---|
| a | Power Factor of the Chiller | 5 | A | 50 |
| e | Total Chilled Water Plant Input Power | 10 | ||
| f | Actual Cooling Capacity of the Chiller | 16 | ||
| g | Part Load of the Chiller | 10 | ||
| h | Chiller Efficiency | 9 | ||
| b | MIP of CHWP | 20 | B | 50 |
| d | MIP of CT | 13 | ||
| i | CHWP Efficiency | 10 | ||
| k | CT Efficiency | 7 | ||
| c | MIP of CWP | 20 | C | 50 |
| j | CWP Efficiency | 10 | ||
| l | System HB (based on primary & secondary CHW loop) | 10 | ||
| m | Chiller Plant OSE | 10 | ||
| n | Cooling Capacity of AHU-1/1 and AHU-1/2 | 21 | D | 50 |
| o | MIP of AHU-1/1 and AHU-1/2 | 10 | ||
| p | Efficiency of the AHUs | 7 | ||
| q | RSHG of Spaces Served | 12 | ||
| Discussion Questions (GROUP Work) – Q7 | 10 | Group | 25 | |
| Discussion Questions (GROUP Work) – Q8 | 15 | |||
Report 2 – Item 1 & Item 2 (Individual Work) and Group Work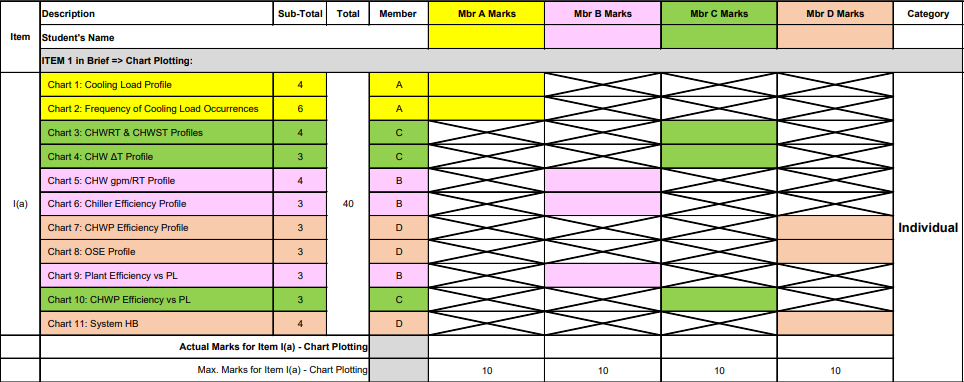
VI. SUBMISSION:
- Submission links on Brightspace Project > Submission > click on the corresponding item
- The penalty for late submission applies as shown in the graphic below:
Hire a Professional Essay & Assignment Writer for completing your Academic Assessments
Native Singapore Writers Team
- 100% Plagiarism-Free Essay
- Highest Satisfaction Rate
- Free Revision
- On-Time Delivery
The post EBM3005 Energy Management and Audit Assignment: Energy Performance Evaluation of a Water-Cooled Central Chilled Water Plant and Air Distribution System Using Live Audit and BMS Data appeared first on Singapore Assignment Help.