| PS212:Computer Methods in Statistics |
Section A – Regression
The SPSS file happiness.sav contains data on the following study.
A psychologist interested in the predictors of happiness recruited 80 participants and obtained data for five variables. There are no missing data.
The variables [with the name] in the SPSS data file are as follows:
1. Sex [sex] – Coded as ‘0’ for male, and ‘1’ for female.
2. Age in years [age; abbreviation = A]
3. Daily hassles score [hassles; abbreviation = DH] – Total score from a multiple-item questionnaire measure of the amount of hassle, inconvenience, or ongoing stress that is experienced in everyday life. A higher score indicates that someone experiences more hassle.
4. Gratitude score [gratitude; abbreviation = G] – Total score from a multiple-item questionnaire measure of gratitude. A higher score indicates that a person expresses more gratitude, whereas a low score indicates that someone expresses less gratitude.
5. Happiness score [happiness; abbreviation = H] – Total score from the Happiness Inventory (a self-report questionnaire). Higher scores indicate greater levels of happiness, and low scores indicate lower levels of happiness.
(a) Obtain the Pearson correlation between each pair of variables and enter them in the table below.

(b) Carry out multiple linear regression with the happiness score as the dependent variable, and the daily hassles and gratitude scores as the predictor variables.
(i) What percentage of the variance in happiness is accounted for by daily hassles and gratitude (together)?
_____ %
(ii) Report the result of the regression. Include one sentence about what the results mean, and report one statistic (which may have multiple components).
(iii)Which are the statistically significant independent predictor(s) of happiness for this analysis?
Daily hassles Gratitude
(iv) Write down the equation for the regression for this analysis (use the abbreviations listed in the question).
(v) If participant 1 and participant 2 score the same on daily hassles, but participant 1 scores one point higher than participant 2 on gratitude, how will participant 1’s predicted happiness compare to participant 2’s?
Who will be happier?
How much happier will they be?
(vi) Describe in two or three sentences what the regression analysis tells you about the relationship between gratitude and happiness. (Use statistics, but also plain English)
(c) Carry out a two-step hierarchical multiple linear regression with the happiness score as the dependent variable. Enter sex and age as predictor variables in the first step, and enter the daily hassles and gratitude scores as predictor variables in the second step. You should obtain the ‘change statistics’ (between the first and second steps).
(i) What percentage of the variance in happiness is accounted for by age and sex (together)?
_____%
(ii) What percentage of the variance in happiness is accounted from by daily hassles and gratitude (together) that is not already accounted for by age and sex (together)?
_____%
(iii) Is there a statistically significant increase in the variance in happiness accounted for between the first and the second steps in this hierarchical regression?
For the statistic that backs up your claim, what is the p-value? _____
(iv) Which are the statistically significant independent predictor(s) of happiness from the second (final) step of this hierarchical regression.
Age Daily hassles
Gender Gratitude
(d) For this part of the question you can ignore age and the daily hassles score. The psychologist has a hypothesis that gratitude mediates a relationship between sex and happiness. (In other words, she claims that gratitude is a mediator variable when sex is treated as an independent variable, and happiness is treated as a dependent variable).
Undertake the appropriate analyses to investigate this hypothesis. (If appropriate, you may make use of analyses that you have undertaken already.) Report the relevant analyses that you use to investigate this hypothesis. (You need only report those elements of the analyses that are relevant to this hypothesis.) State the extent to which the data are consistent with the psychologist’s hypothesis, and briefly justify this answer with reference to the statistics that you report.
Section B – ANOVA
A researcher was interested to know whether a new drug would show improvements to attentional control in children diagnosed with attention deficit hyperactivity disorder (ADHD). She recruited 20 children who were administered both the drug (i.e., treatment) and a placebo. She tested the percentage of errors made by participants during a test of attentional control both before administration of the treatment (pre-test) and one week later (post-test), and before administration of the placebo (pre-test) and one week later (post-test); the order of administration of the conditions was counterbalanced across participants.
She tested the following hypothesis to confirm the effectiveness of the drug on attentional control: the new drug treatment should reduce attentional control errors from pre-post-test, but there should be no change from pre- to post-test when participants receive the placebo.
Data are given in the file ADHD.sav.
Perform a suitable analysis of variance on these data, using appropriate follow-up tests if necessary.
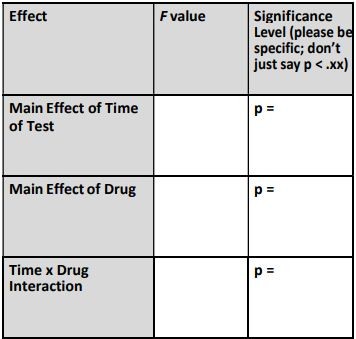
(a) Report the results of the ANOVA, for each of the main effects and the interaction.

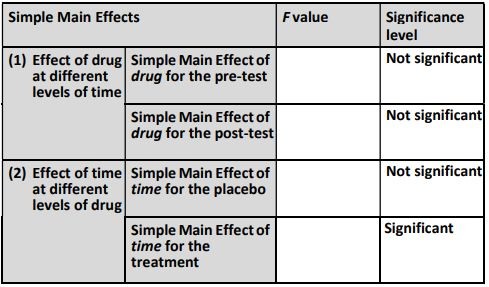
(b) Report the results of the four simple main effects

NOTE: If you haven’t managed to figure out some of the numbers for this question, you can still complete later parts of the question that involve reporting results – just make up some numbers here so we can give you part marks for the remaining questions.
NOTE: We have double-checked the significance levels that are listed; there is no mistake!
(c) Referring to the simple main effects in (b)
(i) Describe in plain English (i.e., no statistics) the results of the simple main effects of the drug at different levels of time
(ii) Describe in plain English (i.e., no statistics) the results of the simple main effects of time at different levels of drug
(iii)It seems like some of the simple main effect (SME) results are inconsistent: when looking at the effect of the drug at different levels of time, both SME’s are nonsignificant, whereas when looking at the effect of time at different levels of drug, one of the SME’s is significant and the other is non-significant. Explain how it is possible for both of these things to be true.
(d) Was the researcher’s hypothesis supported? Write up just the portion of the results that pertain to (i.e., either supports or contradicts) her prediction. Include statistics, but also explain what they mean, in plain English.
SECTION C – Pre-Processing
A researcher wanted to know whether men and women in relationships would differ from each other in their views of their own sexual promiscuity using the following questionnaire:
1. For me, sex without love is OK.
2. I am comfortable and enjoy casual sex with different partners.
3. I am comfortable and enjoy having sex with only my partner and no one else.
4. I often find myself fantasizing about having sex with people other than my partner.
The researcher tested 100 participants (50 men, 50 women) who rated their agreement with the statements on a 1 to 5 Likert scale (1 = strongly disagree; 2 = disagree; 3 = neither agree nor disagree; 4 = agree; 5 = strongly agree)
The raw data are found in the file promiscuity.xlsx. There are no missing data or mistakes in the data. The columns are organized as such:
(A) subject = ID number given to each subject
(B) gender = gender of the subject (male = 1, female = 0)
(C) question = ID number of the question (1-4; see questionnaire above)
(D) response = the response of the subject (1-5; see Likert scale above)
(a) There is a question you should reverse score. Which question is it?
Question 1
Question 2
Question 3
Question 4
(b) Using a formula in Excel, reverse score the variable from part (a) and put the results in a new column called response_revised.
NOTE: The new column (response_revised) should contain the reverse-scored response for the one question that is reverse-scored (i.e., the question from (a)), and the original response for the other questions (the ones that are NOT reverse-scored)
i. What formula did you use to do this?
(c) Use a pivot table to aggregate the data so that there is one promiscuity score for each subject, which is the mean of the responses to the four questionnaire items. This means should reflect the reverse scoring, you did in (b).
When you build a pivot table in Excel, there is a dialog box that looks like something like this: NOTE: This screenshot may not exactly match what you see on the compute
The post PS212:Computer Methods in Statistics Section A – Regression The SPSS file happiness.sav contains data on the following study. A psychologist interested in the predictors of happiness recruited 80 participants and obtained data for five variables. There are no missing data. The variables [with the name] in the SPSS data file are as follows: 1. Sex [sex] – Coded as ‘0’ for male, and ‘1’ for female. 2. Age in years [age; abbreviation = A] first appeared on essaypanel.com.

