Question 1
Banks are often faced with the decision to either grant or deny an application for a credit card loan. ED Bank approaches a social psychologist to help them find a mathematical equation they can use to make their decision. The bank provides the psychologist with data from people who have received credit loans from ED Bank in the past. The data contains a total of 9 variables, including a variable that indicates whether a person had been unable to pay back their loan in the past, i.e. whether a person has defaulted in the past (variable ‘default’). The file bankloan.sav contains the data from this study.
Using the first 50% of cases from your data set, undertake logistic regression to find the best fitting equation to predict defaulting or not from the other variables. Use the forward Likelihood Ratio method and a cut-off of 0.5.
Cross validate your equation using the remaining 50% of cases.
Report all your conclusions and the statistics on which they are based. You should provide a clear and logical report and conclude with a final section drawing your findings together with an interpretation of the data.
(25 marks)
Question 2
An animal shelter has provided data about intake of dogs. An excerpt from the data are in an excel file named shelter_dogs. The table gives the number of dogs that were taken in, classified by the breed of dog (‘breed’), the sex of the dog (‘sex’) and the colour of the coat (‘colour’).
Collapse the data across the variable ‘sex’, separately for the different breeds and coat colours. This way you will generate a data set with only two independent variables (‘breed’ and ‘colour’). Then, enter the data into SPSS using suitable labels.
Undertake a correspondence analysis on the data and determine any patterns that may be present in the relationship between the breed and the colour of the coat. Use tables and/or figures as you see fit.
Report all your conclusions and the statistics on which they are based. You should provide a clear and logical report to justify your thoughts. You should conclude with a final section drawing your findings together with an interpretation of the data.
(25 marks)
Question 3
A psychologist is interested in the effects that people’ personality and social context have on people’s willingness to make an online purchase. To do this she recruited a sample of 60 people that completed a social conformity questionnaire and were subsequently divided into a ‘low social conformity’ (n=30) and a ‘high social conformity’ (n=30) group. Furthermore, people’s willingness to make an online purchase was measured while they received information telling them that a specific item they were looking at had been bought by 92% of the people who had viewed it before them (high popularity item), or that it had been bought only by 8% of people who had viewed it (low popularity item).
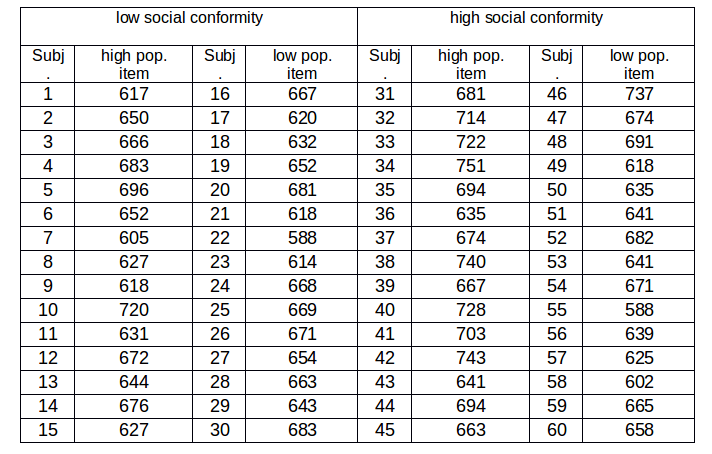
Table 1 shows indicators of people’s willingness to make a purchase during online browsing in the four experimental conditions. Higher scores indicate higher willingness to purchase.
Table 1 – Average indicators of people’s willingness to make a purchase during online browsing in the various experimental conditions. Higher scores indicate higher willingness to purchase.
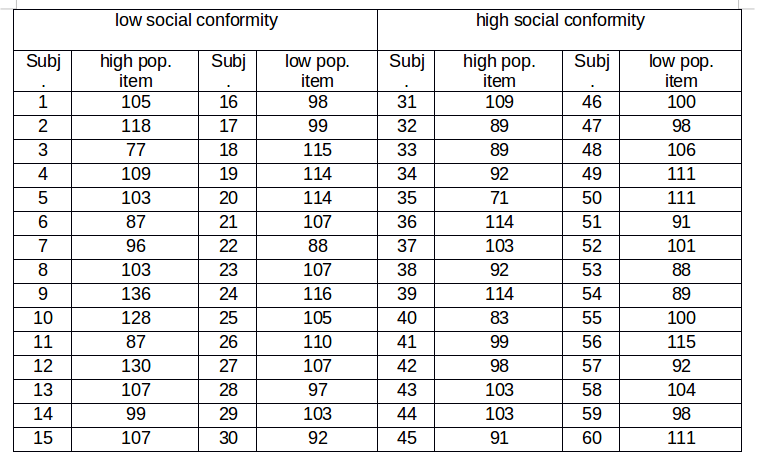
In addition, the researcher collected data about how many seconds each participant took to make their decision. These data are shown in Table 2. Since decision time might play a role in the context of her study, the researcher considers controlling for the effect of participants decision time in her analysis.
Table 2 – Average decision time (in seconds) of participants in the various conditions.
Enter the data from Tables 1 and 2 into SPSS and carry out appropriate analyses to see if there are any effects of the experimental variables, and to consider if decision time should be statistically controlled for in the context of the analysis. Report all your conclusions and the statistics on which they are based.
(35 marks)
Q4.
a) What is the difference between the posterior probability computed using Bayes formula, and the p-value of a statistical test? (5 marks)
b) According to Cohen (1994), which steps should be taken to improve statistical practice? (5 marks)
c) Random factor and fixed factor ANOVA: Consider the following experiments with two independent variables A and B.
Case 1: A is fixed (2 levels) and B is fixed (2 levels)
Case 2: A is fixed (2 levels) and B is random (levels to be chosen)
Assume that you can test a maximum of 60 participants. Describe for both case 1 and case 2 how you would distribute participants across conditions to maximize statistical power. For case 2 this requires choosing the number of levels for variable B. (5 marks)

