Question 1
The towns in Kent with their corresponding x and y coordinates as well as their population are given overleaf. This data is also in an excel file that can be downloaded from Moodle under the name “Kent-Towns”.
(a) Using Excel Solver, or otherwise, establish a location in the plane, that minimises:
(i) the sum of distances to all Kent towns,
(ii) the sum of weighted distances to all Kent towns, with populations as weights,
(iii) the maximum distance to any Kent town, and
(iv) the maximum weighted distance to any Kent town. [8]
(b) Assume from now on that facilities can only be established at the given towns, rather than anywhere in the plane.
(i) Establish at which town a single facility should be built, if the aim is to minimise the sum of distances from the facility to all Kent towns.
(ii) Having established this facility, use the ADD heuristic to find the location of a second facility. Allocate every town to its nearest facility. Explain why these two facilities are not necessarily the optimal solution to the p-facility discrete location problem (p=2). Can you find (using your own heuristic thinking) a pair of locations that gives a better result? [12]
In your answers to the above, clearly explain how you have arrived at your results.
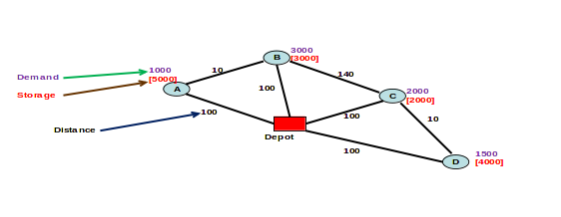
dir=”ltr” width=”512″ cellspacing=”0″ cellpadding=”7″> </div class=”table-responsive”> Question 2Review the global transportation system of an international logistic company. Your report should not exceed 2000 words and should include the items mentioned below.You need to choose a company whose transport system is made up of at least 2 modes of transport. Explain their transportation network and describe which IT or manual system they use. Discuss the company’s strategic fit and the importance of the transportation driver within their supply chain. In your report, you also need to highlight the company’s main competitors, to explain how they deal with green logistics in general and to discuss the challenges the company could face due its global transportation system. Question 3Consider the following network (4 customers and one depot, demand on nodes and costs on arcs are shown) which we started in the class. The number of periods is 4, there is no holding cost at the sites and the products are not perishable. However the customers may have a limited space as shown in the figure below.The aim is to find the schedule over the 4 periods that yields the least total cost. We assume that the vehicle capacity is 5000 units. The company is currently adopting a routing strategy where inventory (storage) kept at customer sites is not taken advantage of, and each customer is visited only once in each period. You are asked to evaluate the current strategy and provide possible improvements by answering the following questions.
-
Show a possible schedule that the company could be adopting and evaluate its corresponding total cost over the four periods. [5]
-
Find the best ‘optimal’ schedule that considers the inventory at the customer sites and record the total cost. [5]
-
Write down the total cost saving over the four periods and the % improvement when compared to the company’s current schedule. Suggest ways on how to allocate the saving obtained to other activities that could add further value to your supply chain and hence make the company more competitive. [5]
-
For a strategic view point, also solve the problem when there is no restriction on the storage at the customer sites (i.e., each customer has enough space) and multiple visits to a customer are also allowed. Discuss your results and its impact on your overall strategy. [5]
 Question 4
-
Consider the 10 jobs on a given machine with their respective due dates and processing times, shown in the table below.
Determine the optimal sequence that minimises dir=”ltr” width=”594″ cellspacing=”0″ cellpadding=”7″ align=”left”> </div class=”table-responsive”>
- the maximum lateness
- the number of late jobs
[10]
-
Consider the case of a flow shop with three machines (M1, M2 and M3). The processing times on each machine are given in the table below. Find the optimal sequence for this production scheduling problem. Produce a Gantt chart. State the makespan. [10]
width=”627″ cellspacing=”0″ cellpadding=”7″> </div class=”table-responsive”>Question 5 Consider the undirected network given below.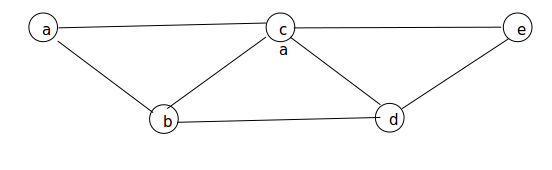
|
TOWN/CITY |
X |
Y |
POPULATION |
Ashford |
600985 |
142805 |
58,178 |
Broadstairs |
639320 |
167760 |
24,370 |
Canterbury |
614880 |
157830 |
42,249 |
Chatham |
575785 |
167920 |
70,540 |
Dartford |
554200 |
174325 |
50,000 |
Deal |
637510 |
152745 |
29,248 |
Dover |
631650 |
141835 |
39,078 |
Faversham |
601530 |
161425 |
18,000 |
Folkestone |
622765 |
135915 |
53,411 |
Gillingham |
577350 |
168385 |
99,773 |
Gravesend |
564730 |
174170 |
51,150 |
Herne Bay |
617900 |
167945 |
31,000 |
Maidstone |
576150 |
155705 |
75,000 |
Margate |
635460 |
170580 |
58,465 |
Northfleet |
562235 |
174310 |
13,590 |
Ramsgate |
638365 |
165180 |
37,967 |
Rochester |
574375 |
168475 |
25,000 |
Royal Tunbridge Wells |
558360 |
139265 |
45,000 |
Sevenoaks |
552375 |
155295 |
18,588 |
Sheerness |
591955 |
174725 |
20,000 |
Sittingbourne |
590740 |
163660 |
55,000 |
Tonbridge |
559080 |
146600 |
31,600 |
Whitstable |
610670 |
166740 |
30,000 |
|
Jobs |
1 |
2 |
3 |
4 |
5 |
6 |
7 |
8 |
9 |
10 |
|||||||||||||||||||||||||||||||||||||||||||||||||||||||||||||||||||||||||||||||||||||
|
Due date |
11 |
8 |
15 |
6 |
20 |
7 |
18 |
10 |
4 |
5 |
|||||||||||||||||||||||||||||||||||||||||||||||||||||||||||||||||||||||||||||||||||||
|
Processing time |
2 |
2 |
4 |
1 |
3 |
3 |
3 |
3 |
1 |
2 |
|||||||||||||||||||||||||||||||||||||||||||||||||||||||||||||||||||||||||||||||||||||
|
Jobs |
1 |
2 |
3 |
4 |
5 |
6 |
7 |
8 |
9 |
10 |
|||||||||||||||||||||||||||||||||||||||||||||||||||||||||||||||||||||||||||||||||||||
|
Processing time on M1 |
12 |
14 |
15 |
20 |
10 |
15 |
11 |
11 |
18 |
15 |
|||||||||||||||||||||||||||||||||||||||||||||||||||||||||||||||||||||||||||||||||||||
|
Processing time on M2 |
8 |
10 |
6 |
5 |
7 |
3 |
5 |
10 |
8 |
9 |
|||||||||||||||||||||||||||||||||||||||||||||||||||||||||||||||||||||||||||||||||||||
|
Processing time on M3 |
9 |
12 |
16 |
11 |
8 |
20 |
12 |
10 |
5 |
12 |
width=”397″ cellspacing=”0″ cellpadding=”7″> </div class=”table-responsive”>
|
edge |
ab |
ac |
bc |
bd |
cd |
ce |
de |
|
distance |
1 |
5 |
2 |
6 |
3 |
7 |
1 |
|
capacity |
4 |
7 |
2 |
5 |
1 |
2 |
6 |
-
Use Dijkstra’s method to find the shortest path from a to e. (Details of your workings must be clearly shown.) Why is this method preferable to Dynamic Programming in this particular instance? [10]
-
Find the maximum flow from a to e and a corresponding minimum cut. [10]

